You may be surprised how much these factors can vary depending on where you live.
Though it’s easy to figure what it will cost to operate a given electric vehicle a set number of miles via the energy efficiency ratings on the Environmental Protection Agency’s fueleconomy.gov website, estimates there are based on national average electricity rates. Those can vary, often wildly, from one state or city to another.
The EPA’s website likewise rates vehicles for their environmental impact, and since electric cars generate zero tailpipe emissions they all get a perfect score of 10 for greenhouse gas emissions and smog ratings. But electricity is generated from different energy sources depending on the region. These include coal, natural gas, petroleum, nuclear, hydro, solar, wind, and biomass, with the net effect on the environment depending on the source. Electric cars tend to be more environmentally friendly when driven in California, New York, and the Pacific Northwest, where renewable energy resources are prevalent, and less so in central U.S. states like Colorado, Kansas and Missouri where fossil-fueled electric plants are most common.
The American Council for an Energy Efficient Economy (ACEEE) ranks all light-duty vehicles sold in the U.S. for their net environmental effect via calculated “Green Scores” on their greenercars.org website. Higher numbers are better, with 42 being the average score among all vehicles. In addition to direct emissions, or the lack thereof, these numbers consider a car or truck’s overall impact on the environment. This includes emissions from manufacturing, the impact of disposal and recycling, and emissions associated with generating electricity, but with the latter at a national average.
Fortunately the ACEEE also maintains a downloadable interactive spreadsheet file that can help EV shoppers and owners understand the true environmental impact of EVs in their specific Zip Codes, based on the local source of electricity. It also gives the regional cost of electricity per kilowatt-hour (kWh) and gives a comparison of how the chosen electric car stands up next to its closest gas-powered equivalent.
You can download the ACEEE’s Electric Vehicle Calculator to see how various EVs stack up where you live here.
In the meantime, we’re featuring the annual cost to run six electric cars and their Green Scores for five U.S. cities having a high ratio of EVs per resident according to the Office of Energy Efficiency and Renewable Energy. The Green Scores and local electricity costs come from the ACEEE’s calculator (we couldn’t obtain regional Green Scores for the Tesla Model 3, however). We gleaned the annual operating costs for each vehicle via the Environmental Protection Agency’s cost calculator at fuelconomy.gov, based on local power rates and assuming 11,640 miles driven per year. We’re presenting the results in the above slideshow.

1. BMW i3
- Los Angeles, California: $600/year @ $0.1832 per kWh; Green Score 75
- Seattle, Washington: $400/year @ $0.1061 per kWh; Green Score 70
- Portland, Oregon: $400/year @ $0.1061 per kWh; Green Score 70
- Honolulu, Hawaii: $1,100/year @ $0.3209 per kWh; Green Score 55
- Burlington, Vermont: $750/year @ $0.2111 per kWh; Green Score 72
- National Average: $450 @ $0.1300 per kWh; Green Score 65

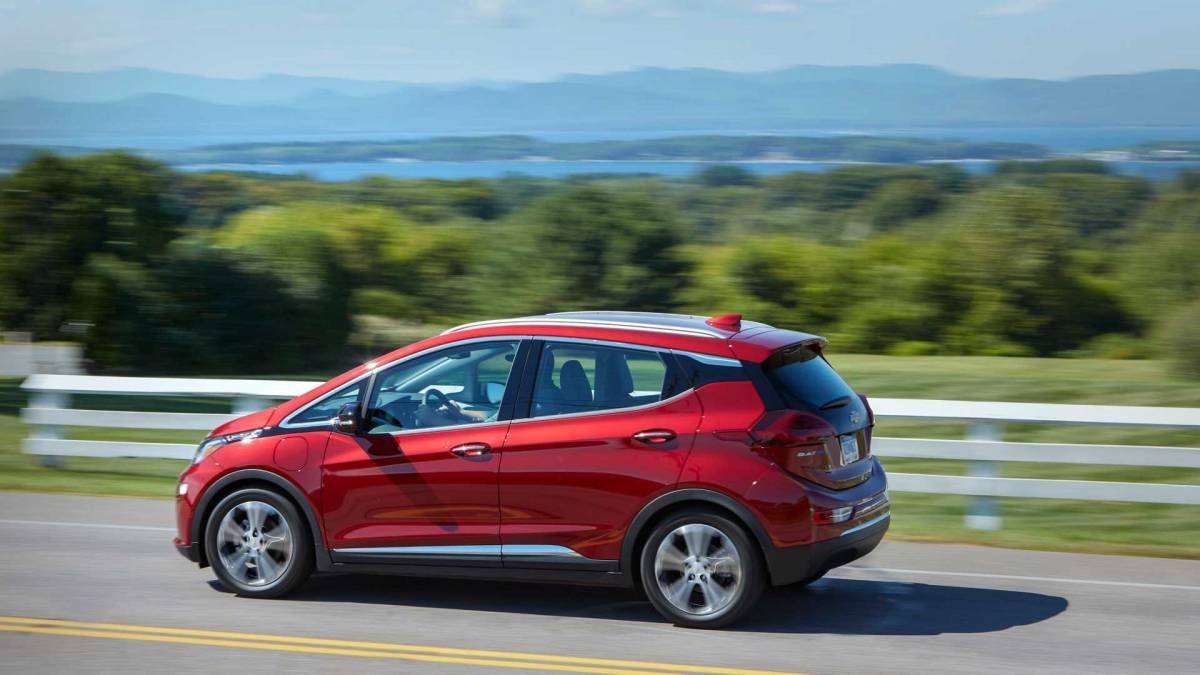
2. Chevrolet Bolt EV
- Los Angeles, California: $600/year @ $0.1832 per kWh; Green Score 69
- Seattle, Washington: $350/year @ $0.1061 per kWh; Green Score 65
- Portland, Oregon: $350/year @ $0.1061 per kWh; Green Score 65
- Honolulu, Hawaii: $1,050/year @ $0.3209 per kWh; Green Score 52
- Burlington, Vermont: $700/year @ $0.2111 per kWh; Green Score 67
- National Average: $450 @ $0.1300 per kWh; Green Score 61